
Utiliser les statistiques pour parier
 Available in US
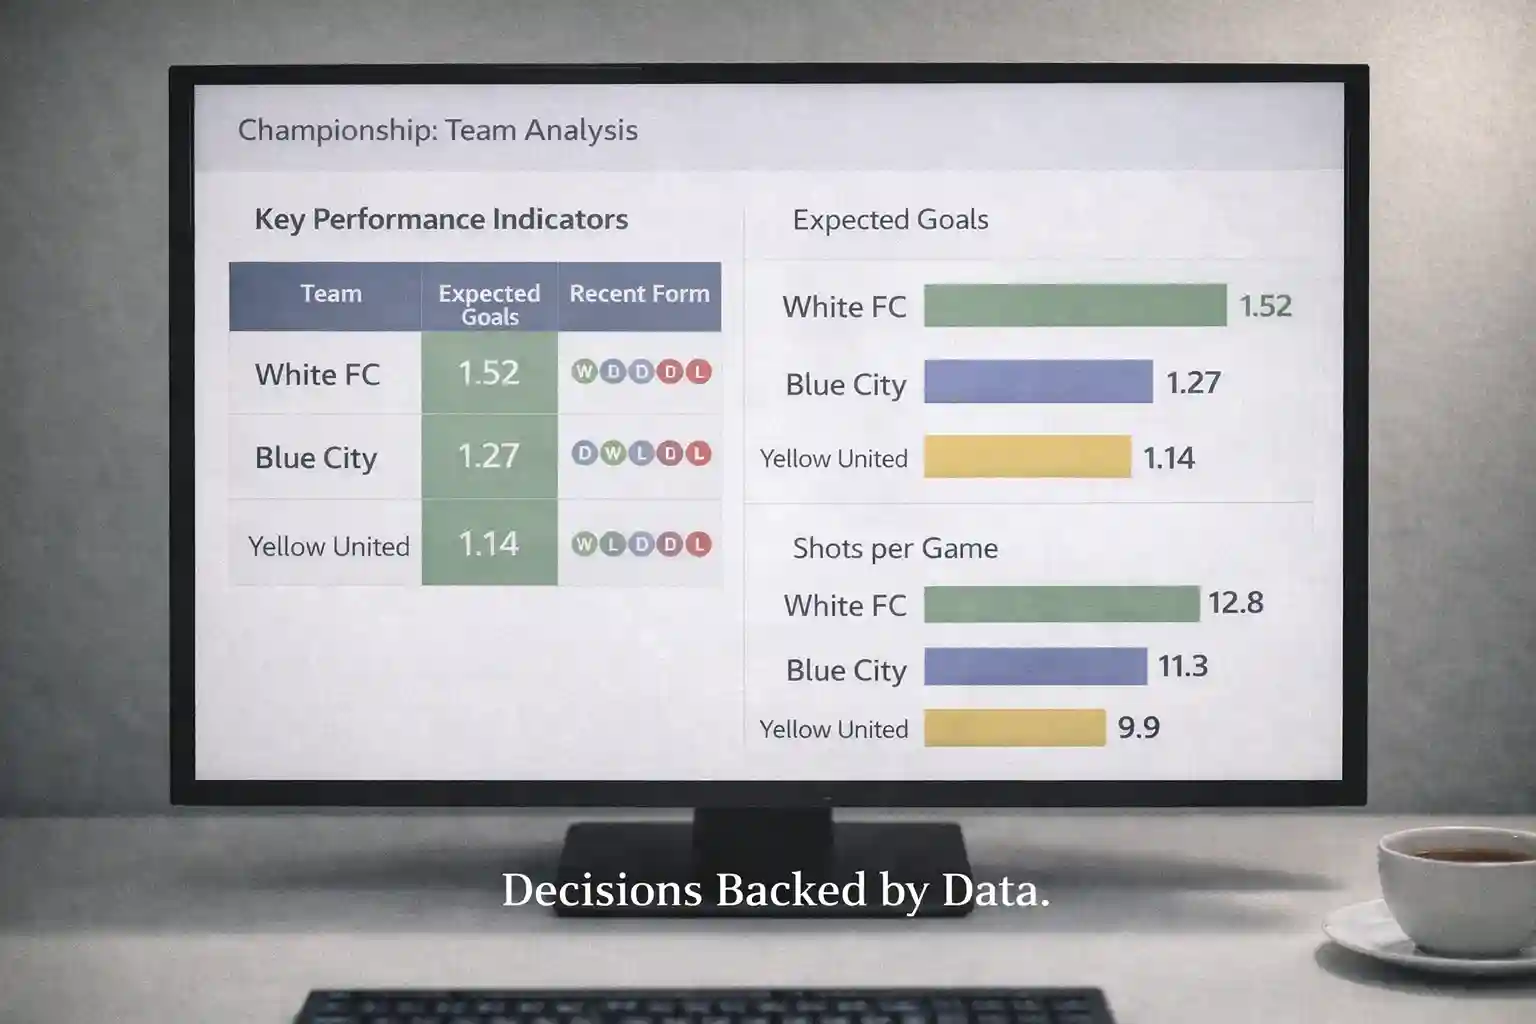
Data analysis has transformed football betting from opinion-based speculation into quantitative discipline. The Championship, with its 552 annual fixtures generating vast statistical datasets, offers particular opportunity for data-driven approaches. While casual bettors rely on table positions and recent results, sophisticated analysts mine deeper metrics to identify mispriced selections that surface-level analysis misses.
What makes Championship data analysis particularly valuable is the division’s relative inefficiency compared to premier leagues. The Premier League attracts enormous analytical attention, with professional operations mining every available data point. The Championship receives less scrutiny, meaning analytical edges that would quickly disappear in top-flight markets can persist longer in second-tier betting. This inefficiency creates opportunities for individual analysts willing to invest in proper data infrastructure.
The challenge lies in distinguishing meaningful signals from noise. Football generates endless statistics, but most carry minimal predictive value. Identifying which metrics genuinely predict future performance, and which merely describe past results without forecasting implications, separates successful data analysts from those drowning in irrelevant numbers.
See how data can help you identify seasonal betting patterns.
Table of Contents
Essential Metrics for Championship Analysis
Certain statistical categories provide genuine predictive value for Championship betting. Understanding these metrics and their applications helps focus analytical efforts productively.
Expected goals represents the most valuable publicly available metric for assessing team quality beyond raw results. By valuing each shot based on historical conversion rates for similar attempts, expected goals reveals whether teams are creating and conceding chances at rates their results reflect. Teams outperforming expected goals, scoring more than shot quality predicts, face regression. Those underperforming might improve without meaningful quality changes. These divergences create betting opportunities.
Expected goals against provides the defensive equivalent, measuring chance quality conceded rather than chances created. Strong defensive teams limit opponents to low-quality attempts, producing low expected goals against regardless of actual goals conceded. This metric reveals defensive quality that goals conceded, influenced by finishing variance, might obscure.
Shot quality metrics beyond expected goals offer additional insight. Shot locations, body parts used, defensive pressure faced, and other contextual factors all inform shot quality assessment. Understanding which Championship teams consistently create high-quality chances versus those accumulating low-value attempts helps predict scoring capability.
Building Your Data Infrastructure
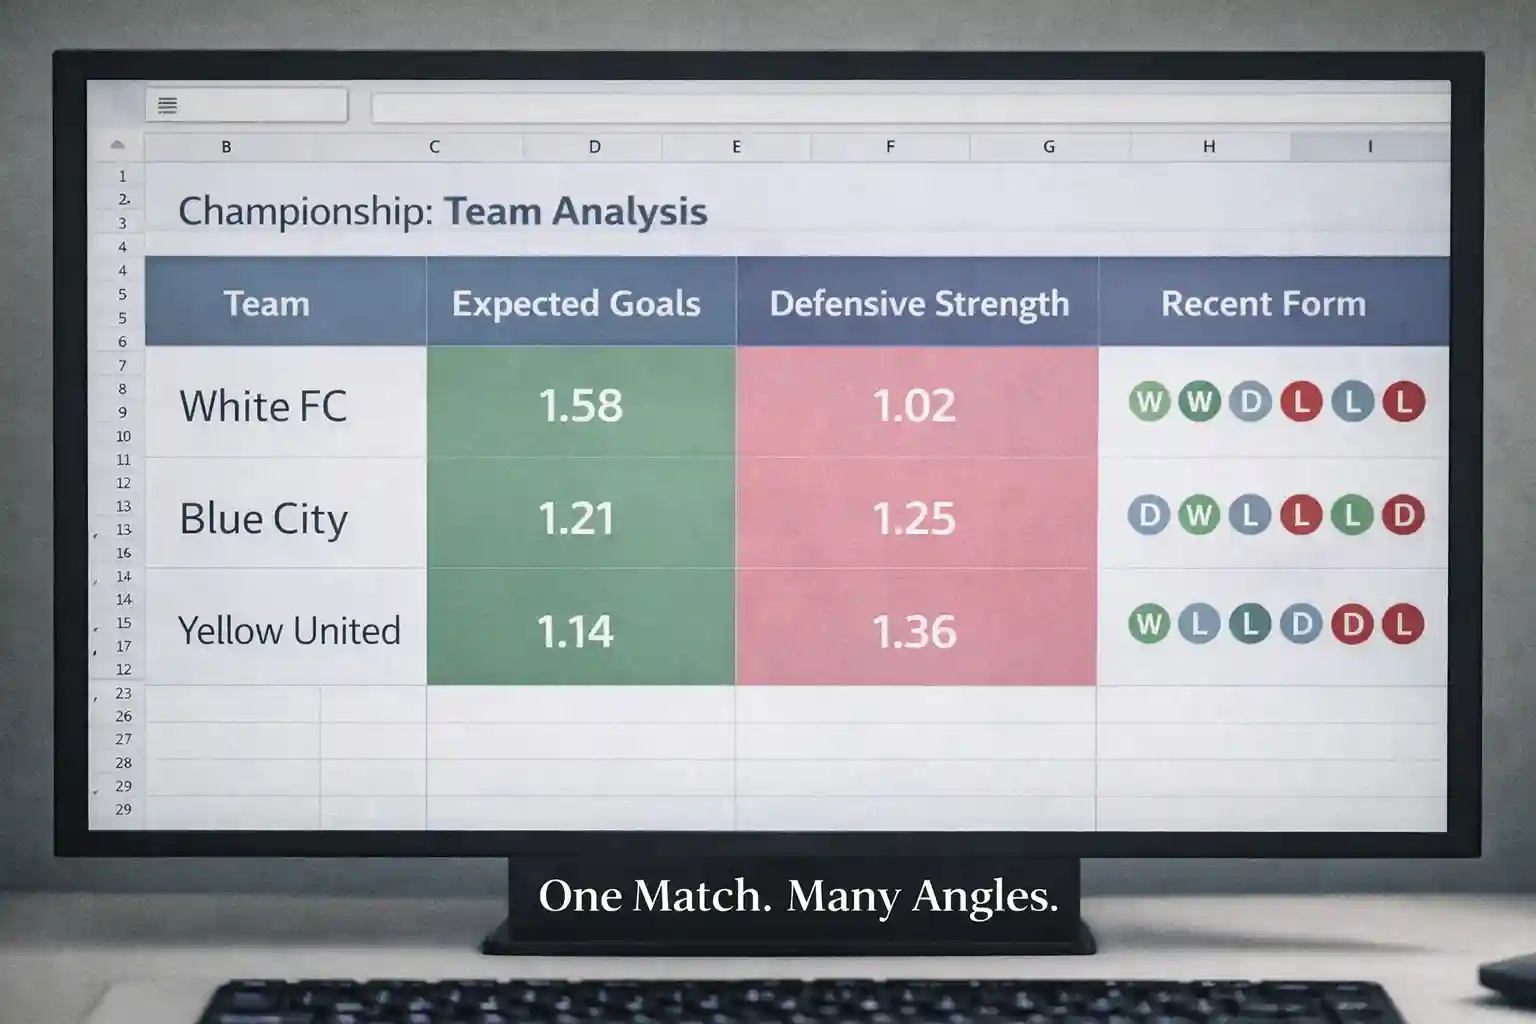
Systematic data analysis requires infrastructure that enables consistent research across the Championship season. Several approaches suit individual bettors with varying technical capabilities.
Spreadsheet-based systems suit those without programming skills. Recording team statistics, calculating metrics, and tracking predictions in spreadsheets provides structure that informal analysis lacks. While limited in sophistication, disciplined spreadsheet tracking far exceeds unstructured approaches.
Database approaches suit those with basic technical skills. Storing match data in structured databases enables queries and analyses that spreadsheets handle poorly. Historical pattern identification, multi-variable analysis, and large-scale trend detection all become feasible with proper database infrastructure.
Statistical programming using tools like R or Python enables sophisticated analysis for those with programming capability. Custom expected goals models, machine learning predictions, and automated betting systems all become possible with programming skills. The investment in learning proves substantial but opens analytical possibilities that simpler approaches cannot match.
Data Sources for Championship Analysis
Accessing Championship data requires knowing where to find relevant statistics. Multiple sources offer different coverage and quality levels.
Free public sources provide substantial data for basic analysis. Websites offering match statistics, league tables, and historical results enable fundamental research without cost. Expected goals data increasingly appears on free platforms, democratizing access to these valuable metrics.
Subscription services offer deeper data with greater historical depth and metric variety. These services provide shot-level data, player performance metrics, and advanced calculations that free sources typically lack. The cost justifies itself for serious analysts whose betting volume makes improved analysis profitable.
Direct data providers sell comprehensive datasets to professional operations. These sources offer the deepest, most granular data available but at prices that typically exceed individual bettor budgets. Understanding that professional competitors access superior data helps calibrate expectations about achievable edge.
Avoiding Statistical Pitfalls
Data analysis contains numerous traps that produce false confidence in meaningless patterns. Recognizing these pitfalls prevents wasted effort on spurious signals.
Sample size requirements prove larger than intuition suggests. A team’s form over five matches tells you almost nothing reliable about their quality. Even full-season samples contain substantial noise. Championship teams play 46 matches per season, providing moderate but not overwhelming sample sizes for most analyses.
Regression to the mean affects extreme performances. Teams with exceptional early-season records typically regress toward league average. Those struggling early often improve. Mistaking temporary extremes for sustainable quality leads to backing or opposing teams at precisely wrong moments.
Overfitting occurs when models capture noise rather than signal. Complex models that perfectly explain historical data often fail to predict future results because they’ve learned random patterns rather than genuine relationships. Simpler models that capture fewer historical nuances often predict better by avoiding overfitting.
Correlation doesn’t imply causation in football statistics. Two metrics might move together without either causing the other. Identifying genuine causal relationships, rather than coincidental correlations, requires domain understanding that pure data analysis cannot provide.
Combining Data with Contextual Analysis
Pure statistical analysis misses contextual factors that significantly affect match outcomes. Integrating data with qualitative assessment produces more accurate predictions than either approach alone.
Team news affects match outcomes in ways historical statistics cannot capture. Key player absences, returning injured players, and squad rotation decisions all influence results independently of statistical profiles. Checking team news before finalizing data-driven predictions prevents backing statistical profiles that current circumstances don’t support.
Motivational factors escape statistical measurement. Teams with nothing to play for might underperform their quality. Those in promotion or relegation battles might exceed statistical expectations through intensity that numbers can’t capture. Incorporating motivational assessment alongside data analysis improves prediction accuracy.
Tactical matchups create specific interactions that aggregate statistics might miss. A team’s pressing approach might disrupt one opponent’s build-up while proving irrelevant against another. Understanding specific matchup dynamics adds predictive value beyond general statistical profiles.
Model Building Fundamentals
Developing prediction models requires understanding fundamental principles that separate useful models from misleading ones.
Training and testing separation prevents overfitting. Building models on one dataset and validating on separate data reveals whether patterns generalize or merely describe historical noise. Models that perform well only on training data provide false confidence that testing reveals.
Feature selection determines which variables your model uses. Including too many features risks overfitting. Including too few might miss important relationships. Systematic approaches to feature selection, testing different combinations while monitoring validation performance, help identify optimal variable sets.
Probability calibration ensures model outputs reflect actual probabilities. A model predicting 60% win probability should be right about 60% of the time when making such predictions. Calibration testing reveals whether model probabilities are reliable or systematically biased.
Regular retraining updates models as conditions change. Last season’s patterns might not persist this season. Periodic model updates incorporating recent data help maintain predictive accuracy as the Championship evolves.
Practical Application to Betting
Translating data analysis into betting decisions requires frameworks that connect statistical insights to specific positions.
Probability comparison drives betting decisions. Calculate your data-driven probability for each selection and compare against implied probability from bookmaker odds. When your probability exceeds implied probability sufficiently to overcome commission and modeling uncertainty, you’ve identified potential value.
Confidence intervals acknowledge modeling uncertainty. Your probability estimates aren’t precise. Understanding the range within which true probability likely falls helps size positions appropriately. Higher confidence intervals, meaning more uncertain estimates, warrant smaller stakes than precise estimates.
Multiple model consensus provides robustness. When different analytical approaches converge on similar conclusions, confidence increases. When models disagree, uncertainty remains high regardless of any single model’s prediction.
Continuous Improvement
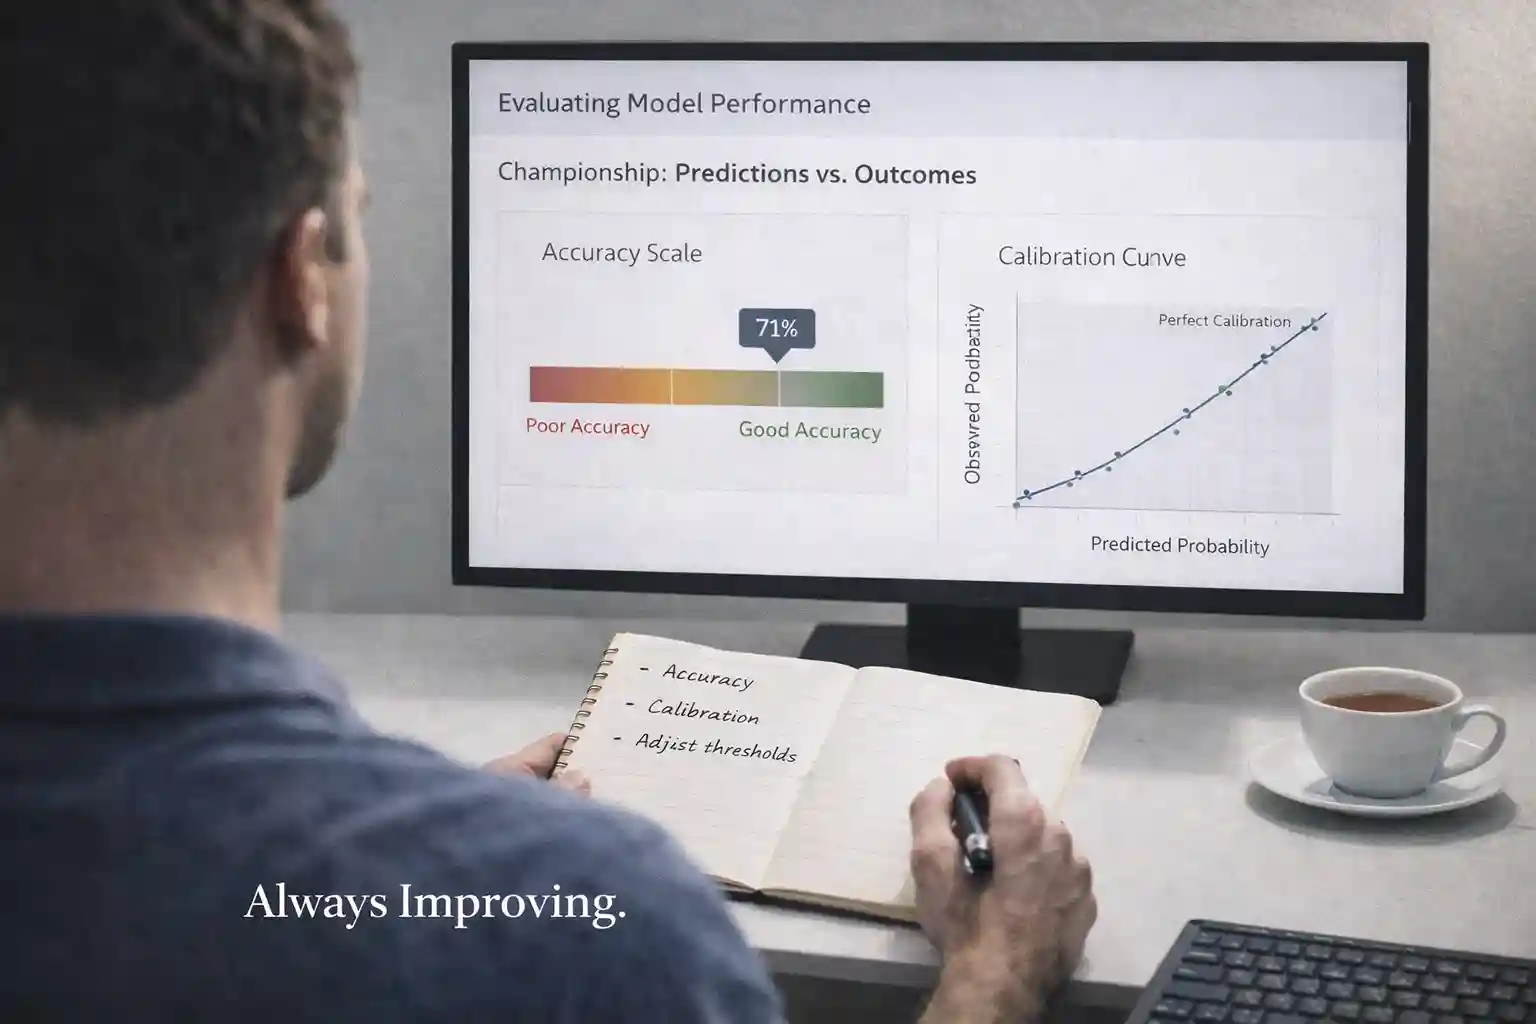
Data analysis expertise develops through iteration and learning. Several practices accelerate improvement while building sustainable analytical capabilities.
Track predictions and results rigorously. Recording your predicted probabilities alongside actual outcomes reveals calibration issues, identifies strengths and weaknesses, and provides the feedback necessary for improvement.
Study analytical failures particularly carefully. Understanding why predictions failed, whether through data limitations, model flaws, or contextual factors you missed, teaches more than confirming successes.
Follow analytical developments in the broader community. Statistical approaches to football analysis continue evolving rapidly. Staying current with methodological developments helps incorporate improvements into your own analysis.
Championship data analysis rewards those who develop genuine analytical capabilities rather than merely collecting statistics. The infrastructure investment, both technical and intellectual, proves substantial. But for those who persist, the combination of Championship market inefficiency and sophisticated analysis creates opportunities that opinion-based betting cannot match.
Master the statistics on our English football portal.